Data for AdventureWorks Bike Store Tableau Dashboard

To build this business intelligence dashboard in Tableau, I used T-SQL to query online retail sales data from a fictional bike store in the MS SQL Server example database AdventureWorksDW (open source and publicly available).
Below are:
- A diagram showing the relationships between each table in the database.
- The SQL query used to pull the data to make the dashboard.
- The XLSX output from the query before it was imported into Tableau.
AdventureWorksDW Schema Visualization
To see larger version of diagram:
Desktop: Right-click here and open in a new tab. Then hold Control (PC) or Command ⌘ (Mac) and scroll to zoom in and out on the new image. Use the horizontal and vertical scroll bars in your browser window to pan across the image. You may need to zoom back out when you switch back to another tab.
Mobile: Pinch and unpinch on touchscreen on below image to zoom.

This database has a snowflake schema layout, meaning that it has fact tables near the center of the diagram that contain info on business events such as sales, and dimension tables near the outer edges that provide additional info to elaborate on aspects of the fact tables.
Unlike a star schema design, which only has one level of dimension tables around the fact tables, many of the dimension tables here are further broken down into separate tables.
This increases the amount of normalization in the database, which reduces redundancy and possible errors when updating info, but makes querying more complex by requiring more joins to connect the information back together.
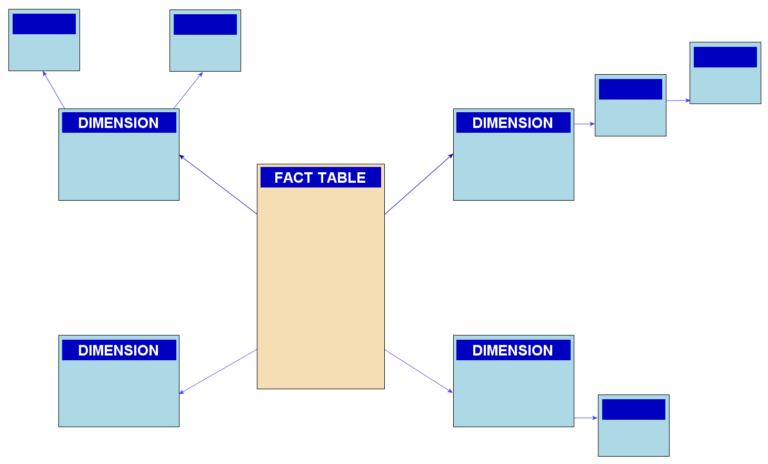
The snowflake schema is a hybrid in that it has more normalization than a star schema, but not as much as an OLTP (Online Transaction Processing, such as those used in banking) or other highly normalized system.
For example, the DimProduct dimension table contains info about products such as color, size, and product name.
If included in the FactInternetSales fact table, this info would cause a ton of redundancy, so instead it is placed in its own dimension table, with a ProductKey connecting both tables.
According to snowflake schema, the product info is further split into DimProductSubcategory and DimProductCategory tables (see bottom left side of above AdventureWorksDW diagram).
SQL Query
SELECT

FactInternetSales.SalesOrderNumber,
FactInternetSales.OrderDate,
FactInternetSales.OrderQuantity,
sum(FactInternetSales.TotalProductCost) AS TotalProductCost,
sum(FactInternetSales.SalesAmount) AS TotalSalesAmount,
sum(FactInternetSales.SalesAmount) - sum(FactInternetSales.TotalProductCost) AS GrossMargin,
(sum(FactInternetSales.SalesAmount) - sum(FactInternetSales.TotalProductCost)) / sum(FactInternetSales.SalesAmount) AS GrossMarginPct,
DimProduct.EnglishProductName AS ProductName,
DimProductCategory.EnglishProductCategoryName AS ProductCategory,
DimProductSubcategory.EnglishProductSubcategoryName AS ProductSubcategory,
IIF(DimSalesTerritory.SalesTerritoryCountry = 'United States',CONCAT(DimSalesTerritory.SalesTerritoryRegion,' ','US'),DimSalesTerritory.SalesTerritoryRegion) AS SalesTerritory,
DimSalesTerritory.SalesTerritoryRegion AS SalesTerritoryRegion,
DimSalesTerritory.SalesTerritoryCountry AS SalesTerritoryCountry,
DimSalesReason.SalesReasonName AS SalesReason

FROM FactInternetSales

    INNER JOIN DimProduct
    ON FactInternetSales.ProductKey = DimProduct.ProductKey

    INNER JOIN DimProductSubcategory
    ON DimProductSubcategory.ProductSubcategoryKey = DimProduct.ProductSubcategoryKey

    INNER JOIN DimProductCategory
    ON DimProductCategory.ProductCategoryKey = DimProductSubcategory.ProductCategoryKey

    INNER JOIN DimSalesTerritory
    ON FactInternetSales.SalesTerritoryKey = DimSalesTerritory.SalesTerritoryKey

    INNER JOIN FactInternetSalesReason
    ON FactInternetSales.SalesOrderNumber = FactInternetSalesReason.SalesOrderNumber

    INNER JOIN DimSalesReason
    ON FactInternetSalesReason.SalesReasonKey = DimSalesReason.SalesReasonKey

GROUP BY

    FactInternetSales.SalesOrderNumber,
    FactInternetSales.OrderDate,
    FactInternetSales.OrderQuantity,
    DimProduct.EnglishProductName,
    DimProductCategory.EnglishProductCategoryName,
    DimProductSubcategory.EnglishProductSubcategoryName,
    IIF(DimSalesTerritory.SalesTerritoryCountry = 'United States',CONCAT(DimSalesTerritory.SalesTerritoryRegion,' ','US'),DimSalesTerritory.SalesTerritoryRegion),
    DimSalesTerritory.SalesTerritoryRegion,
    DimSalesTerritory.SalesTerritoryCountry,
    DimSalesReason.SalesReasonName

ORDER BY SalesOrderNumber DESC
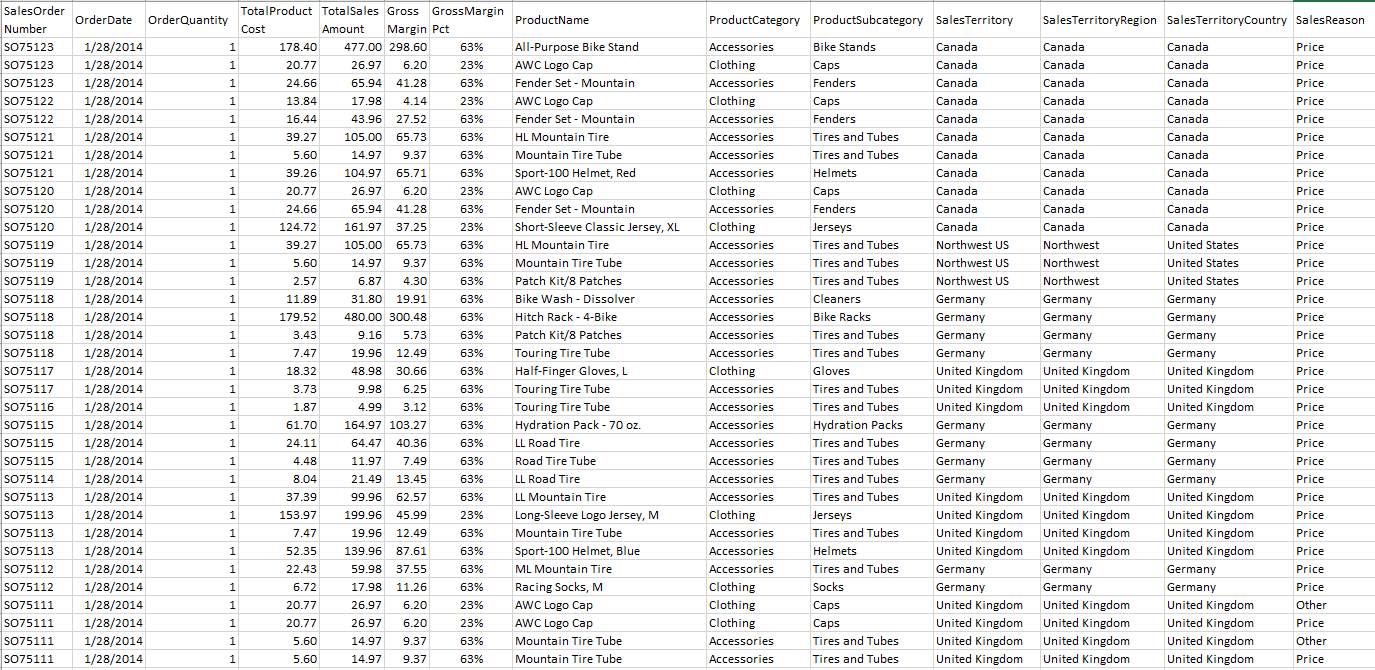
Query Output
The output of the query was 64,516 rows. Below is a screenshot of the first 34 rows after some minor date and percentage data type formatting in Excel. The data was very clean and did not require much modification. Per the SQL query, it is sorted in descending order by Sales Order Number. Because it would later be processed in Tableau, it did not need to be sorted in any particular way. Download the XLSX file of the raw SQL query output here (4 MB).